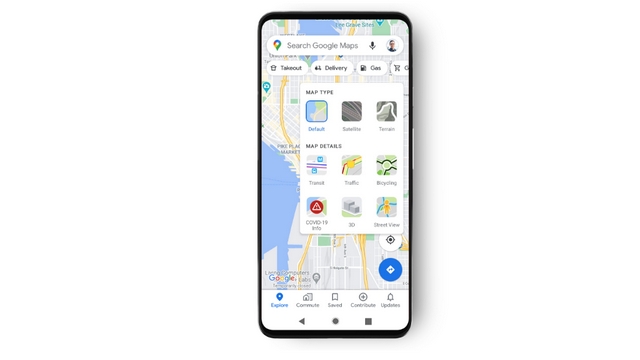
Once this new feature reaches your device, you will see a “COVID-19 info” layer alongside other layers when you tap on the layers button present to the top right corner of Maps. The layer shows weekly averages of new COVID cases per 100,000 people in an area. Image: Google The COVID-19 info layer is color-coded so that you can learn the current state at a glance. The company is using a total of six colors to represent the density of cases, along with a trend indicator. The colors and their representation are as follows:
Grey: Less than 1 case Yellow: 1-10 cases Orange: 10-20 cases Dark orange: 20-30 cases Red: 30-40 cases Dark red: 40+ cases
Google is sourcing data from multiple sources including Johns Hopkins University, the New York Times, and Wikipedia. These sources get their data from the World Health Organization, government health ministries, state and local health agencies, and hospitals, so the data should be fairly accurate and trustworthy. According to Google, trending case data is available across 220 countries supported by Maps. Google says the new COVID layer starts rolling out on Android and iOS this week. As of this writing, the new layer is not available on the phone I checked, but it should come in the upcoming days.